Page 68 - 14_Atti_SIN_SNO_2022_flip
P. 68

Proceedings SNO                                                   “Percorsi clinici in Neuroscienze”


                                      A                            B                          C


                                   D                        E                           F


                                           G                            H


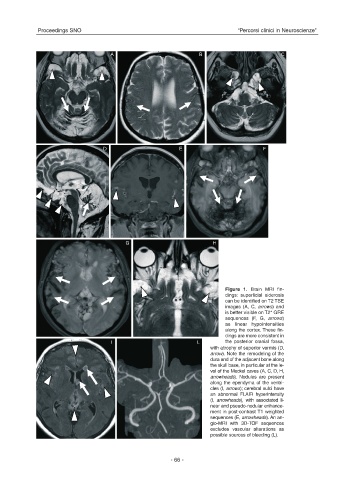
                                                                            Figure 1. Brain MRI fin-
                                                                            dings: superficial siderosis
                                                                            can be identified on T2 TSE
                                                                            images (A, C, arrows) and
                                                                            is better visible on T2* GRE
                                                                            sequences (F, G,  arrows)
                                                                            as linear hypointensities
                                                                            along the cortex. These fin-
                                                                            dings are more consistent in
                                      I                           L         the  posterior cranial fossa,
                                                                       with atrophy of superior vermis (D,
                                                                       arrow). Note the remodeling of the
                                                                       dura and of the adjacent bone along
                                                                       the skull base, in particular at the le-
                                                                       vel of the Meckel caves (A, C, D, H,
                                                                       arrowheads). Nodules are present
                                                                       along the ependyma of the ventri-
                                                                       cles (I, arrows); cerebral sulci have
                                                                       an abnormal FLAIR hyperintensity
                                                                       (I,  arrowheads), with associated li-
                                                                       near and pseudo-nodular enhance-
                                                                       ment in post-contrast T1 weighted
                                                                       sequences (E, arrowheads). An an-
                                                                       gio-MRI with 3D-TOF sequences
                                                                       excludes vascular alterations as
                                                                       possible sources of bleeding (L).


                                                          - 66 -
   63   64   65   66   67   68   69   70   71   72   73